Animated Interactive Dashboards Diagramics is a proud member of:
Diagramics Animated DashboardsAnimationIf "animation" only means slick effects showing the graphics being constructed, then it is a waste of resources and of the user’s time.
A good effective business dashboard does not need animation. The graphics should appear instantly in their completed state. 
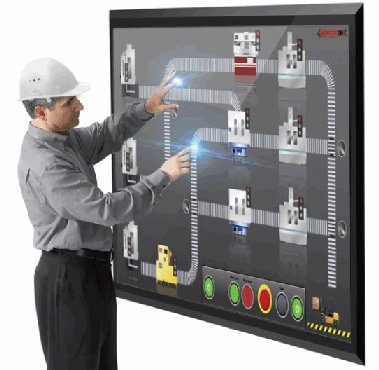
Diagramics animated dashboards use animation to show the user how conditions or performance have changed over time. InteractivityIn addition to meaninful animation, Diagramics dashboards also provide interactivity. Interactivity may mean the ability of a user to drill down on a chart to see further information, or the ability to change some inputs to see effects on these changes and perform visual analytics on data. Visual AnalyticsVisual analytics is "the science of analytical reasoning facilitated by interactive visual interfaces." Today, data is produced at an incredible rate and the ability to collect and store the data is increasing at a faster rate than the ability to analyze it. Visual Analytics methods allow decision makers to combine their human flexibility, creativity, and background knowledge with the enormous storage and processing capacities of today’s cloud computing to gain insight into complex problems. Using advanced visual interfaces created and rendered on-fly by Diagramics native client and cloud server software, humans may directly interact with the data analysis capabilities of today’s computer, allowing them to make well-informed decisions in complex situations |
interactive media
animated dashboards
remote monitoring
IoT real-time data visualization
augmented reality

