interactive media
animated dashboards
remote monitoring
IoT real-time data visualization
augmented reality
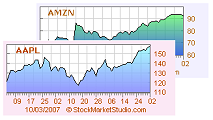
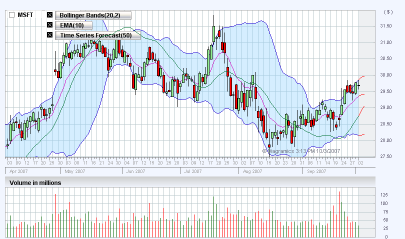
Financial Charting
Diagramics is the proud developer of XpressCharts
financial charting solution for one of the world's best online broker - OptionsXpress.com Diagramics Financial Charting SolutionsDiagramics Software Corporation provides organizations such as online brokers, banks, web portals, and other firms conducting business over the web the ability to reliably outsource the responsibility for graphical financial web content – charts, images and diagrams.Our client roster includes companies ranging from well-respected companies to fast paced start-ups. Our two clients groups include:
Diagramics Financial Charting Server
Diagramics Financial Charting Server is a powerful, hight-performance web server developed specifically for use by the financial organizations, online brokers, banks, stock exchanges, and financial web sites. Diagramics Financial Charting Server is licensed and branded by some of the biggest names (e.g. OptionsXpress.com) in the business to bring advanced charting, and visualization technology to professional traders, analysts and self-directed investors. Diagramics Financial Charting Server is an extensible, easy to customize financial charting engine. It is one of the most advanced charting application for graphical analysis of financial and stock market. |


