Operations Control Centers Diagramics is a proud member of:
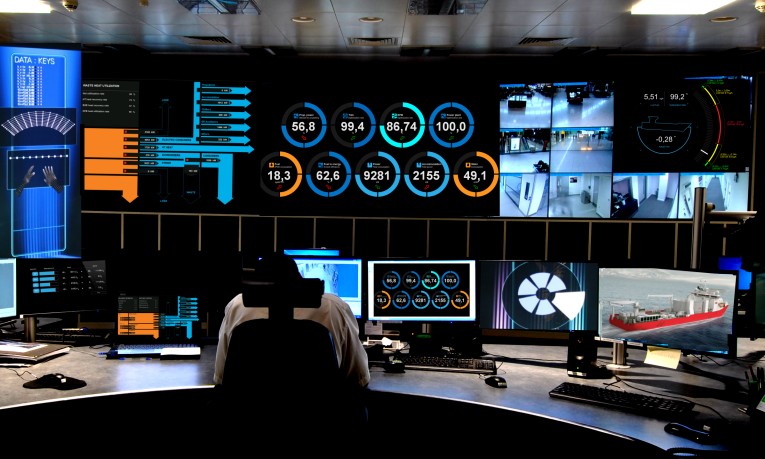
Operations Control CentersThe operational heart of any business is its Control Center. A well-designed Control Center allows you to keep an eye on all your product lines and business activities in one place and get a full picture of your production thanks to numerous monitors displaying timely and relevant information. 
Diagramics' Operations Control Center is a multi-screen visualization solution that delivers a "visual concerto" performed by a group of synchronized animated dashboards. VisualizationVisualization transforms machine-generated digital information into interactive visual presentations that allow Control Center operators to consume the information in milliseconds. Diagramics' Operations Control Center is a multi-screen visualization solution that delivers a "visual concerto" performed by a group of synchronized animated dashboards, each powered by a tiny computer running Windows 10 IoT Core and Diagramics Visual Player software. Each computer generates graphics out of data and templates and renders visuals "in-place" - locally and directly to the screen it attached to, thus eliminating the need for AV cables, powerful video cards, expensive graphical servers and heavy network traffic.AutomationAutomation provides Control Center with invisible connectivity links to your equipment, backend and cloudvisual visu services, IoT devices and sensors, orchestrating complex processes of ingestion, transformation and distribution of data via various informational and visual channels. Distributon of the visualization tasks, templates, and encrypted data streams to dashboard computers is orchestrated by the Azure-cloud-hosted or on-premises-hosted Diagramics Visual Server, which is also responsible for various critical aspects of the solution – content management, access control, visual template management, data binding, digital media, IT & IoT process automation. AffordabilityAffordability. Perhaps not-mission-critical, but very important aspect is the affordability of your Control Center. Prepare to answer these questions:
Diagramics will help you to answer these and many other related questions with its new Diagramics Visual Automation Platform and custom visualization solutions for Operations Control Centers. |
interactive media
animated dashboards
remote monitoring
IoT real-time data visualization
augmented reality

